











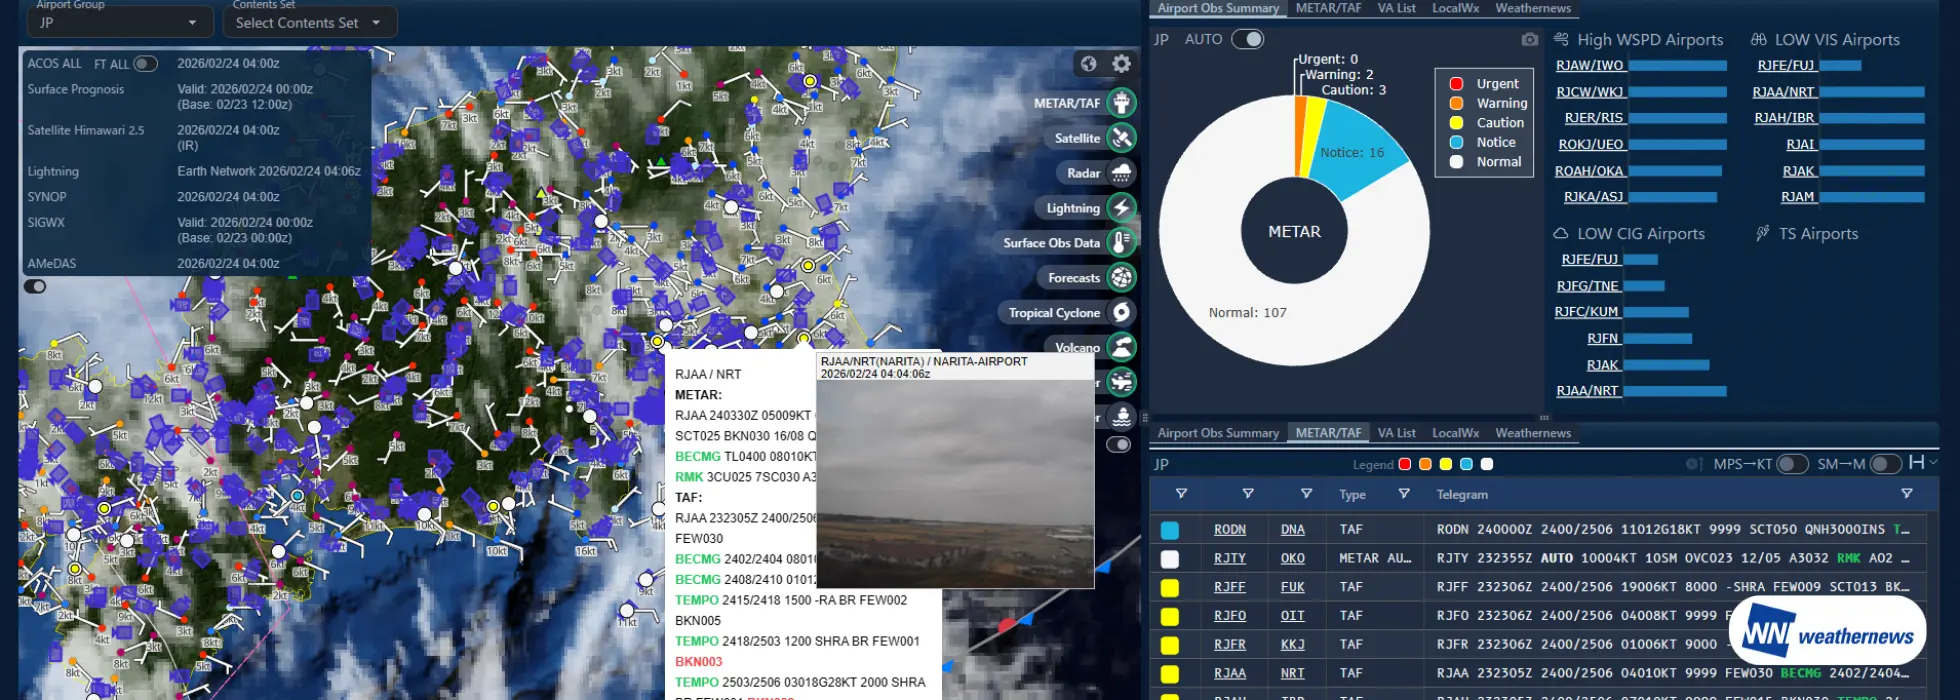
Narita International Airport (RJAA/NRT) is an international hub airport located in Narita City, Chiba Prefecture, in the eastern part of the Greater Tokyo area, Japan.
At Narita Airport, the prevailing wind direction shows significant seasonal variability. In particular, spring (March–May) is not only the peak season for inbound travel to Japan due to the cherry blossom period, but also a time when rapid wind shifts and gust risks tend to increase as air masses transition. Therefore, accurately understanding wind characteristics is essential for effective operational planning.Strong winds of 20 knots or higher are observed throughout the year at Narita Airport, with the highest frequency occurring in March.
Topography and Winds at Narita Airport
Narita Airport is situated on the Hokuso Plateau, which extends southwest to northeast across the northeastern part of Chiba Prefecture in the eastern Kanto Plain, at an elevation of approximately 40 meters. Although there are no mountains within a 60 km radius, small valleys and rivers lie to the north and southeast of the airport—roughly aligned with the runway orientation—creating uneven terrain that tends to induce airflow disturbances. In addition, the airport is located about 20 km inland from the Pacific coast, and thus exhibits inland climate characteristics such as a relatively large diurnal temperature range. These geographic features have a notable influence on the airport’s weather.
From the northeast to northwest of the airport, large green areas including rivers and lakes—such as Lake Kasumigaura, the Tone River, and Lake Inbanuma—together with extensive farmland, act as sources of water vapor and contribute to humid conditions. The surface soil of the Hokuso Plateau consists of the fine-grained volcanic ash known as the Kanto Loam Layer. In early spring, when crop cover is limited, this soil is easily lifted by strong winds, making the area prone to blowing dust.
Prevailing (Mean) Winds
① The representative wind reported in METAR and TAF corresponds to observations at the south end of Runway A (near the RWY34L touchdown zone).
② The annual wind directions can be broadly classified into the following three patterns
②-1 Northwesterly winds associated with the winter monsoon
②-2 Southerly winds associated with the summer monsoon and lows over the Sea of Japan
②-3 Northeasterly (north to northeast) winds associated with south-coast low-pressure systems
③ On days not affected by significant weather disturbances, a diurnal variation in wind direction is observed: southerly winds tend to prevail during the daytime, while northerly winds prevail at night.
④ The most frequently observed wind direction is 010°–030°, while the least frequent is 250°–260°.
⑤ South-southeasterly (SSE; 140°–170°) winds also occur relatively often. Easterly and westerly winds are comparatively infrequent.
⑥ The annual mean wind speed is 6.4 KT, and the most frequently observed wind speed is 4 KT.
⑦ Mean wind speeds of 6.4 KT or higher most often occur with wind directions of 340°–070°, 190°–240°, and 300°–320°. In other words, northwesterly and northeasterly winds are both frequent and relatively strong. Although southwesterly winds occur only about half as often as northwesterly or northeasterly winds, they frequently exceed 10 KT on average and are stronger than winds from other directions.
Strong Winds (≥15 KT)
① Wind directions associated with strong winds (≥15 KT) can be broadly grouped into three sectors: 010°–040° (northeasterly), 210°–230° (southwesterly), 300°–320° (northwesterly)
② The wind directions associated with strong winds vary by season.
③ Regarding duration, about half of strong-wind events last 2 hours or less, and roughly 80% last 5 hours or less. However, about 8% persist for more than 8 hours. The longest event lasted 42 hours, associated with a south-coast low in April 1985.
④ The annual average number of days with a daily maximum wind speed of ≥20 KT is 39.3 days, while days with ≥30 KT average 2.3 days per year.
⑤ Strong winds of ≥20 KT are observed throughout the year, but they occur more frequently from January through April and less often from June through August. The peak month is March, averaging 6.2 days.
Gust
In METAR reports, gusts are observed approximately 200 times per year on average. About 85% of these events end within 1 hour, and roughly 93% end within 3 hours. However, cases lasting more than 10 hours occur about twice per year on average, with the longest event lasting 19 hours, associated with a south-coast low in May 1997.