











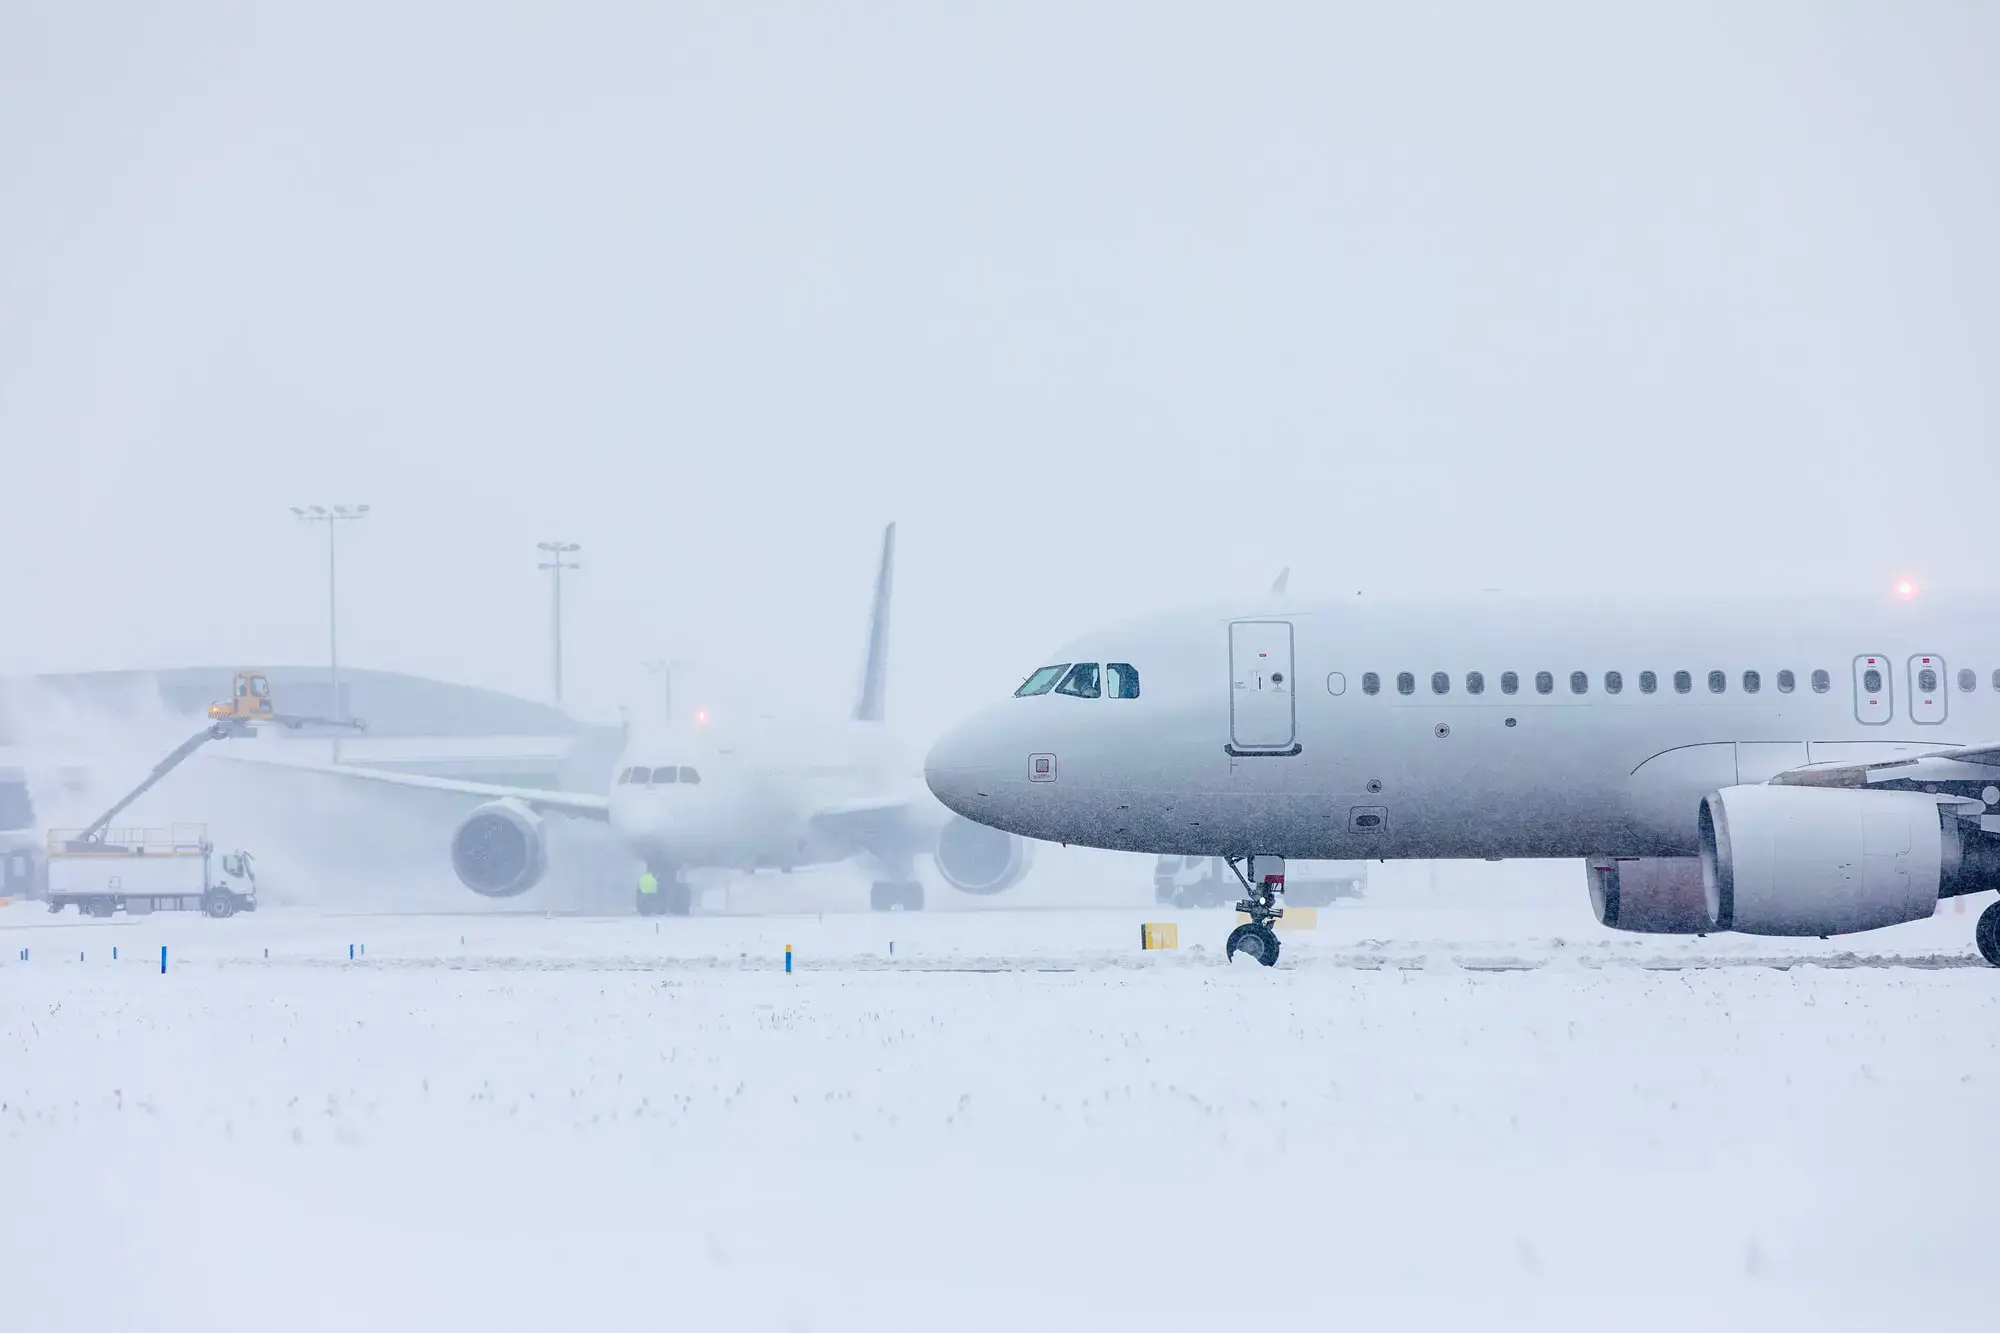
Winter Storm Fern impacted the eastern US, triggering widespread aviation disruption, with more than 10,000 flights canceled by January 25.
However, the impacts are far from over. The National Weather Service (NWS) forecasts an unusually prolonged cold spell, with sub-freezing air expected to persist through around February 1.For the aviation industry, this is not merely a short-lived winter storm, but a sustained operational risk lasting nearly two weeks.
Zooming In on the Weekend: Weekend Weather Outlook for the Eastern US (January 31–February 1)
From January 31 through February 1, a deep trough accompanied by cold air of −36°C or lower at the 500 hPa level is expected to move southeastward from the central to eastern US, while a surface low pressure system tracks northeastward along the US Atlantic coast. As a result, heavy snowfall is possible across the eastern US. As snowfall intensifies, strong winds may develop, raising concerns for deteriorating road conditions due to snow accumulation and icing, as well as significant visibility reductions.
In Myrtle Beach, precipitation is expected to begin as rain and transition to snow; however, freezing rain (FZRA) or ice pellets (PL) remain possible depending on surface temperature trends. In Boston and Raleigh, precipitation is forecast to fall as snow from the onset.
Please note that the timing, snowfall amounts, and precipitation type remain sensitive to the evolution of the upper-level trough, surface low, and thermal structure.
Weekend Weather Outlook for Selected Major Airports in the Eastern US
| Airport | Logan International Airport | Raleigh–Durham International Airport | Myrtle Beach International Airport |
|---|---|---|---|
| City | Boston | Raleigh | Myrtle Beach |
| ICAO/IATA | KBOS / BOS | KRDU / RDU | KMYR / MYR |
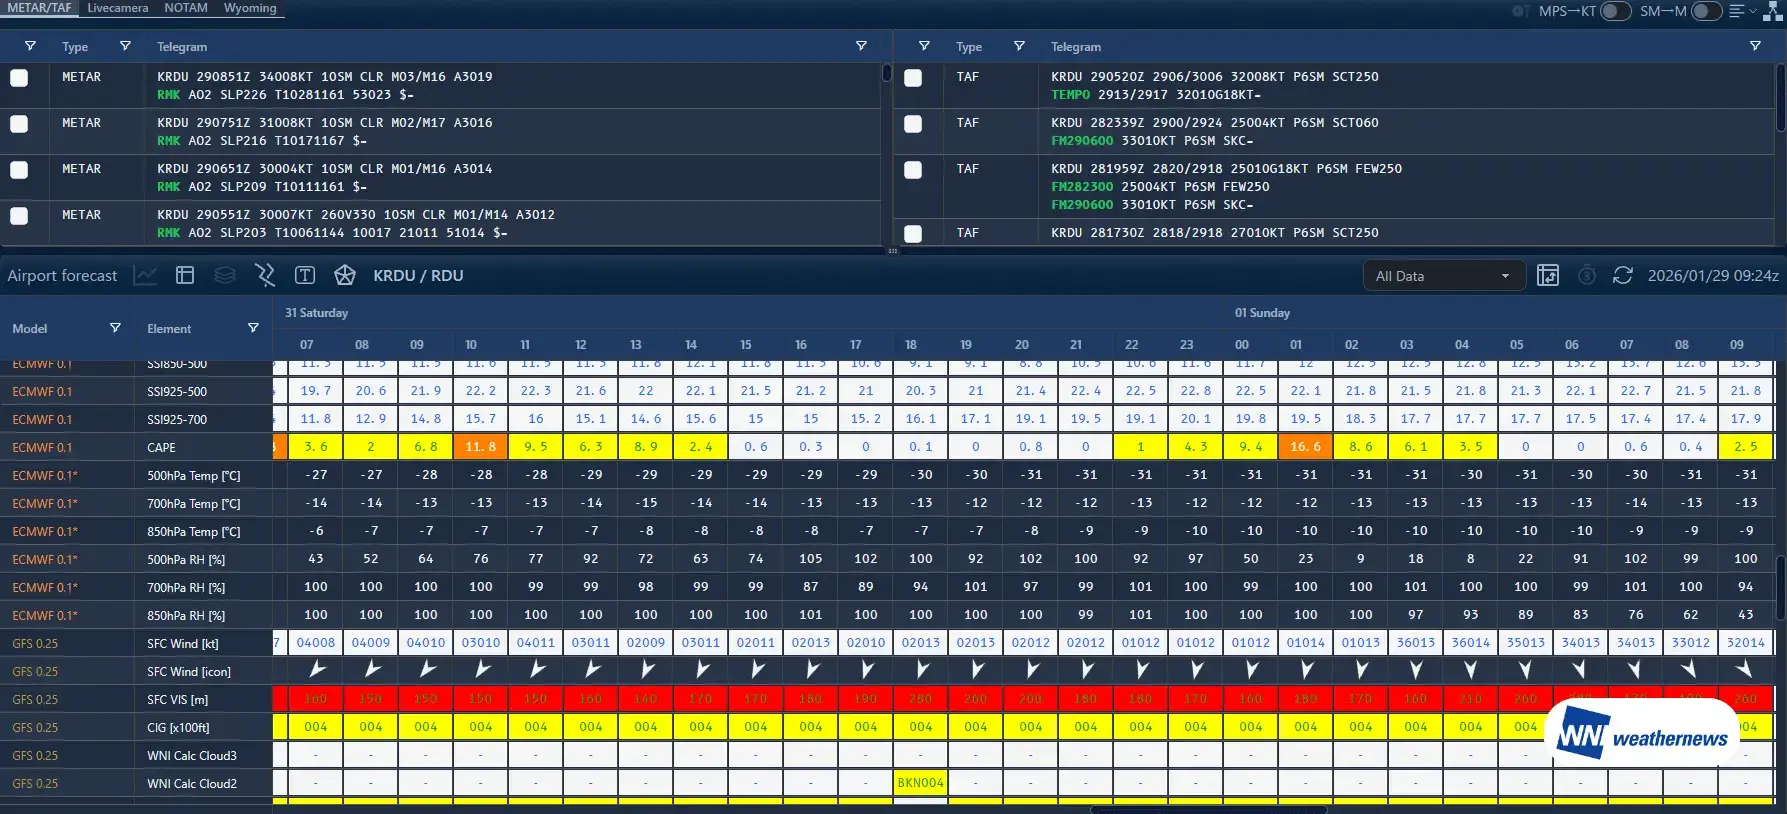
| Snow Timing | from 0300 UTC 1 Feb to 1500 UTC 2 Feb | from 0300 UTC 31 Jan to 1200 UTC 1 Feb | from 1800 UTC 31 Jan to 1500 UTC 1 Feb |
| Peak Snowfall Period | from 1500 UTC 1 Feb to 2100 UTC 1 Feb | from 1800 UTC 31 Jan to 0600 UTC 1 Feb | from 0000 UTC 1 Feb to 0900 UTC 1 Feb |
| Low VIS / CIG due to Snow | from 1500 UTC 1 Feb to 2100 UTC 1 Feb | from 1800 UTC 31 Jan to 0600 UTC 1 Feb | from 0000 UTC 1 Feb to 0900 UTC 1 Feb |
| Forecast Snowfall Amount (through 0000 UTC Feb 3rd) | 15–20 cm | 40–60 cm | 30–50 cm |
| Freezing Precipitation (PL / FZRA) | NIL | NIL | NIL |
| Strong Winds ≥ 20 kt | from 1500 UTC 1 Feb to 0100 UTC 2 Feb | NIL | NIL |
| Minimum Temperature during Snowfall | −9℃ (1100–1600 UTC 1 Feb) | −10℃(2200 UTC 31 Jan – 0200 UTC 1 Feb) | −8℃(1100–1300 UTC 1 Feb) |
What Is Required to Manage a Prolonged Cold Wave?
The defining characteristic of this cold wave is the repeated cycle of temporary easing followed by renewed deterioration.
While conditions showed brief improvement on January 26–27, another surge of Arctic air is expected to arrive on January 31. For airlines, this has made it extremely difficult to determine when normal operations can safely resume. In prolonged cold events like this, it is critical to look beyond ‘today’s weather’ and understand how risks will evolve through the coming week.
Key questions include: ・When and where will additional Arctic air impact operations? ·Which airports are likely to see increased de-icing activity? ・How will operational risk evolve across the entire network?